How to Calculate Contribution Margin from Your Amazon TACoS Data
ACoS is the check-engine light. TACoS is the oil pressure gauge.
Those are not the same instrument. One tells you something is happening inside the engine. The other tells you whether the engine is safe to run at all.
Contribution margin from Amazon TACoS data is calculated in three layers. First, take gross revenue and subtract platform fees — referral fees, FBA fulfillment fees, and storage costs that standard dashboards routinely omit. Second, subtract cost of goods and every variable fulfillment cost that moves with each unit sold. Third, apply the TACoS figure to isolate what advertising is actually costing at the margin level — not as a campaign metric, but as a real drain on what the channel returns.
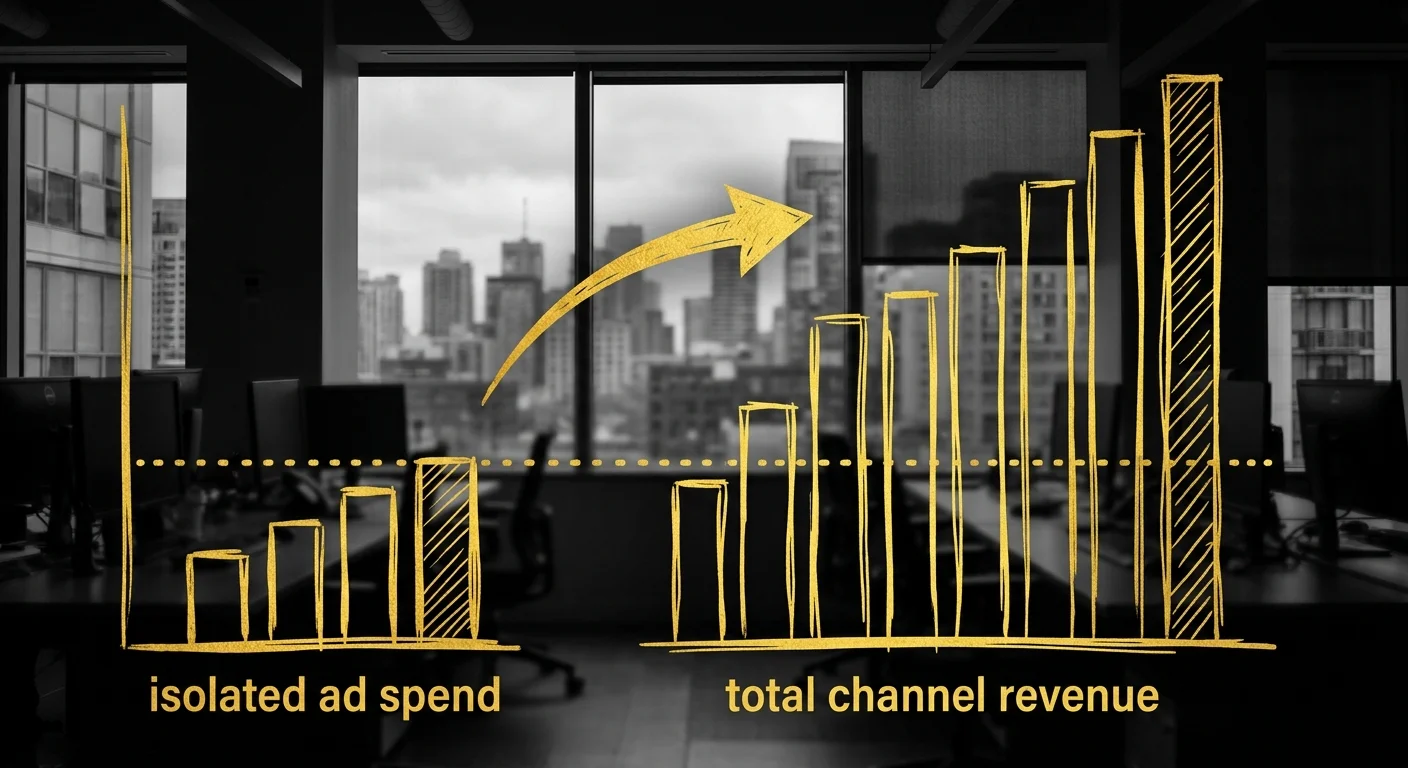
ACoS measures how efficiently ad spend generates ad-attributed revenue. TACoS measures advertising spend as a percentage of total channel revenue — including organic sales. A brand can run a clean ACoS while organic velocity declines and the channel loses profitability. The dashboard looks clean. The P&L does not.
Contribution margin is the calculation that closes that gap. It isolates the true variable costs of selling on Amazon and prevents platform fee omissions from distorting whether a product line or advertising program is actually viable. Without it, brands fund advertising against a revenue number — not against what the channel returns after Amazon takes its share.
The result is a single, defensible figure: the margin left after every variable cost associated with selling a unit on Amazon, including the advertising that drove the sale. That figure answers the question ACoS cannot — whether the channel is generating profit or consuming it.
Last Updated: June 15, 2026
- • Why ACoS Alone Cannot Tell You If Your Amazon Channel Is Profitable
- • What TACoS Actually Measures and Why It Changes the Calculation
- • The Step-by-Step Contribution Margin Calculation Using TACoS Data
- • Where Standard Reporting Dashboards Break the Calculation
- • What a Healthy Contribution Margin Looks Like on Amazon — and What It Signals
-
• Frequently Asked Questions
- • Why does optimizing for a low ACoS often mask severe erosion in a brand's actual contribution margin?
- • What is the primary point of failure when brands try to calculate contribution margin using automated dashboard tools?
- • What integration challenges arise when merging Amazon FBA fee structures with offline COGS data?
- • Can a brand scale Amazon advertising profitably if its current contribution margin is below thirty percent?
- • How long does it typically take to audit historical TACoS data to identify hidden margin leaks?
- • Stop Watching the Wrong Gauge
Why ACoS Alone Cannot Tell You If Your Amazon Channel Is Profitable

ACoS is the check-engine light. It tells you something is happening in the engine bay. It doesn't tell you whether the car is making money or burning through capital.
Most brands manage Amazon advertising by chasing a low ACoS. It looks like discipline. It reports cleanly in every agency deck. But eroding your actual profits with misleading ad metrics is exactly what happens when you optimize a campaign-level metric that was never built to measure channel profitability.
ACoS tells you one thing: how efficiently your ad spend generates ad-attributed revenue. That's it. It doesn't answer whether the channel is profitable after every variable cost is paid. Those two questions can have completely opposite answers at the same time.
Why ACoS-Only Optimization Is the Wrong Model
Here's what the ACoS-only model misses. Focusing purely on campaign-level ACoS fails to measure how paid media spend catalyzes organic customer acquisitions. When organic velocity is quietly declining, a tightly optimized ACoS won't surface it. The metric absorbs the signal and reports clean.
That's the trap. You can run a 15% ACoS on a channel that's losing profitable ground every month. The metric looks right. The P&L doesn't. And because measuring how advertising affects organic sales requires a different calculation entirely, most brands never see the divergence until the margin damage is already done.
Contribution margin isolates the true variable costs so platform fee omissions don't quietly distort whether an ad program is viable. That's the diagnostic layer ACoS was never built to provide. And it's exactly why total business efficiency on the channel requires a different metric entirely. TACoS optimization for Amazon brands
The ACoS-only model isn't just incomplete. It's actively misleading. It rewards cutting ad spend to lower the ratio — which can suppress the organic flywheel and compound the very revenue decline it's masking. TACoS is the oil pressure gauge. It's the reading that tells you whether the engine is safe to run at all.
| Metric | What It Measures | What It Misses | Risk of Over-Relying on It |
|---|---|---|---|
| ACoS (Advertising Cost of Sale) | How efficiently ad spend generates ad-attributed revenue | Organic sales velocity, platform fees, fulfillment costs, and total channel profitability | A low ACoS can mask a declining channel — the metric looks healthy while contribution margin erodes |
| TACoS (Total Advertising Cost of Sale) | Advertising spend as a percentage of total channel revenue, including organic sales | Unit-level variable costs and gross margin structure — TACoS is a channel health signal, not a profitability calculator on its own | Without pairing TACoS to contribution margin, you know the channel's advertising dependency but not whether it's profitable |
| Contribution Margin | The margin remaining after every variable cost associated with selling a unit — COGS, fulfillment, platform fees, and advertising | Campaign-level efficiency — contribution margin doesn't tell you which keywords or ad types drove the sale | Calculated in isolation from TACoS, it answers whether the channel is profitable but not whether advertising is compounding or draining that profit |
| Campaign ROAS (Return on Ad Spend) | Revenue generated per dollar of ad spend within a specific campaign or ad group | Total channel revenue, organic halo effect, and any cost that sits outside the ad campaign itself | High ROAS on a single campaign can coexist with deeply unprofitable channel economics — it measures a slice, not the P&L |
What TACoS Actually Measures and Why It Changes the Calculation
TACoS — Total Advertising Cost of Sale — measures advertising spend as a percentage of total channel revenue. Not just ad-attributed revenue. Everything the channel generates, including organic sales.
That one word — total — is the entire argument.
That difference changes what you're measuring. Monitoring TACoS shifts the analytical focus from isolated click efficiency to compound organic growth over time. When organic velocity is healthy, TACoS falls even as ad spend holds steady. When organic velocity is eroding, TACoS rises — regardless of what ACoS reports.
The two metrics can tell completely opposite stories at the same time. Only one of them is telling the truth about your channel.
This is why TACoS is the metric that feeds a real contribution margin calculation. ACoS isn't. Contribution margin requires total business efficiency on the channel as its input. ACoS was built to report campaign performance.
Those are not the same instrument. Not even close.
How TACoS Reveals Organic Health
Here's what organic health actually looks like in the TACoS reading. A brand scaling ad spend aggressively will often see ACoS hold flat or even improve — the campaigns are optimized, the ratio looks clean. But if TACoS is rising at the same time, total revenue isn't growing in proportion to ad investment.
Organic is not compounding. The channel is becoming more dependent on paid traffic, not less.
That's not a growth story. That's a dependency story.
Focusing purely on campaign-level ACoS fails to measure how paid media spend catalyzes organic customer acquisitions. That's not a minor omission. Organic velocity is the signal that a brand is building durable channel equity — the kind that compounds without proportional ad spend increases.
When ACoS optimization suppresses bids to hit a ratio target, it can quietly throttle the spend that was driving organic rank. The channel looks efficient. It's actually shrinking.
And the dashboard never tells you.
The holistic profitability of digital channels only becomes visible when you measure against total revenue — not just ad-attributed clicks. That's what TACoS provides. Nothing else on the standard dashboard does.
Once you have a reliable TACoS figure, you apply it directly in Layer 3 of the contribution margin calculation. It stops being a campaign stat. It becomes a margin cost — a real number that shows what advertising is actually taking out of the P&L.
That's when the oil pressure gauge gives you an honest reading.
| TACoS Range | What It Signals | Likely Organic Health Status | Recommended Action |
|---|---|---|---|
| Low and declining over time | Organic velocity is compounding — paid spend is driving rank and reviews that convert without ads | Strong | Maintain or modestly scale ad investment to preserve flywheel momentum |
| Low but flat despite rising ad spend | Ad campaigns are efficient but organic growth has stalled — the channel is not building equity | Plateauing | Audit organic rank trends and listing conversion rates before adding more paid budget |
| Rising alongside revenue growth | Ad investment is outpacing organic velocity — paid traffic is doing heavy lifting the channel hasn't yet earned organically | Developing | Evaluate whether contribution margin at current TACoS still supports the spend level before continuing to scale |
| High and rising while revenue is flat or declining | The channel is becoming more dependent on paid traffic with no organic compounding — margin erosion is active | Deteriorating | Conduct a full contribution margin audit using all three layers before adding any incremental ad spend |
The Step-by-Step Contribution Margin Calculation Using TACoS Data

Definitions done. Here's the actual math.
The foundational role of contribution margin isn't a finance exercise. It's the only method that answers the question your ad dashboard can't: is this channel actually profitable after everything it costs to run?
Contribution margin isolates true variable costs to prevent overhead metrics from skewing advertising viability models. Every fee, every unit cost, every dollar of ad spend gets accounted for before you declare anything profitable.
Skip any one of those inputs and the number lies to you.
Three layers. Each one strips another coat of noise from the number.
What's left at the end is the only figure that matters: the margin remaining after every variable cost attached to selling a unit on Amazon — including the advertising that drove the sale.
That's what you're building toward.
Layer 1: Gross Revenue Minus Platform Fees
Start with gross revenue. Every dollar attributed to the product over the measurement period.
Then subtract all platform fees — before you touch anything else.
Here's where most brands already have a problem.
Referral fees, FBA fulfillment fees, and storage costs don't live in the same report. They're scattered across fee categories that standard dashboards treat as separate line items — or skip entirely.
The dashboard looks complete. It isn't.
Pull every platform fee manually if the export won't give them to you cleanly.
The number you're left with after Layer 1 isn't profit. It's net revenue after Amazon's take. It's the only honest starting point for everything that follows.
Layer 2: Subtract COGS and Variable Fulfillment Costs
Layer 2 removes cost of goods and every variable fulfillment cost that moves with each unit sold.
Manufacturing cost. Inbound freight. Prep costs. Returns handling.
Anything that only exists because a sale happened.
This is the layer that tells you whether a product is structurally viable — before advertising is even part of the question.
If the margin left after Layers 1 and 2 is thin, no advertising efficiency improvement fixes that. You'd be optimizing a campaign on top of a product the channel's economics can't support.
The ads aren't the problem. The product can't carry the cost structure.
Layer 2 draws the line between what advertising can fix and what it can't.
If the margin isn't there before ad spend enters the picture, no campaign optimization saves it.
Layer 3: Apply Your TACoS Figure to Isolate Advertising's True Margin Impact
Layer 3 is where TACoS enters.
Take your TACoS figure — advertising spend divided by total channel revenue — and apply it as a margin cost against the number you have after Layers 1 and 2.
You're not treating advertising as a campaign budget anymore. You're treating it as a variable cost of sale. The same way you treat fulfillment.
That reframe is the entire diagnostic shift.
Once advertising spend is expressed as a per-unit margin cost — not a campaign efficiency ratio — you can directly compare it to the margin available after platform fees and COGS.
One number. Does the channel generate profit, or consume it? That's the true return on ad spend at the bottom line that ACoS was never designed to calculate.
This is the reading that matters.
The operational handling of your ad programs determines whether Layer 3 tightens the margin or compounds it. That's the difference between running the channel and being run by it.
ACoS is the check-engine light. Contribution margin built on TACoS data is the oil pressure gauge. One tells you the campaign is running. The other tells you whether it's safe to keep the engine on.
| Calculation Layer | Input Required | Where to Find It | Common Error That Distorts the Result |
|---|---|---|---|
| Layer 1 — Gross Revenue Minus Platform Fees | Total gross revenue for the measurement period; all Amazon platform fees (referral fees, FBA fulfillment fees, storage fees) | Amazon Seller Central fee reports; Payments dashboard — pulled manually and reconciled across fee categories | Using net revenue figures that already have some fees subtracted, or relying on dashboard summaries that omit storage and return-processing fees entirely |
| Layer 2 — Subtract COGS and Variable Fulfillment Costs | Unit cost of goods; inbound freight; prep and packaging costs; returns handling cost — every cost that only exists because a unit sold | Internal COGS records; freight invoices; 3PL or prep center billing — not Amazon reports, which do not carry manufacturing or inbound data | Applying an averaged or blended COGS figure across SKUs with different cost structures, which masks which products are structurally viable before advertising is factored in |
| Layer 3 — Apply Your TACoS Figure to Isolate Advertising's True Margin Impact | Total advertising spend for the period; total channel revenue for the same period (ad-attributed and organic combined) | Amazon Advertising console for spend; Seller Central business reports for total revenue — both figures pulled for the identical date range | Using ACoS instead of TACoS as the advertising input, which counts only ad-attributed revenue in the denominator and excludes organic sales — making advertising appear cheaper per dollar of revenue than it actually is |
Where Standard Reporting Dashboards Break the Calculation

The math isn't the problem.
The inputs are.
Standard reporting dashboards routinely omit critical platform fees, distorting contribution calculations. That's not a rounding error. That's a structural flaw. It invalidates the margin number before you've touched a single formula.
E-commerce margins face severe pressure from platform take-rates, and accounting for complex platform fee structures requires manual integration of FBA fee structures, return rates, and real-time storage overhead.
Most dashboards weren't built for that. They were built to report campaign performance.
Those are two completely different instruments.
The Platform Fees Most Dashboards Omit
Here's what disappears: referral fees, FBA fulfillment fees, monthly storage charges, aged-inventory surcharges, and return processing costs don't land in a single report.
They're scattered across fee categories that Amazon's native tools treat as separate line items — or omit entirely from the seller-facing summary view.
You're not seeing a clean number. You're seeing a partial one.
So brands look at a contribution margin figure calculated on incomplete cost data — and make advertising decisions based on it.
Calculating real margins requires manual integration of FBA fee structures, return rates, and real-time storage overhead. A dashboard pull doesn't do that. Deliberate reconciliation does.
The difference between those two approaches is the difference between a real margin number and a convincing-looking guess.
The margin structures in modern retail are under mounting pressure from platform take-rates. Evaluating unit contribution margin is critical for brands managing complex supply chains and digital marketing expenses.
When storage fees spike seasonally and return rates climb on a specific ASIN, those costs need to flow through the Layer 1 calculation in real time — not surface as a quarterly surprise.
Brands that reconcile this manually are the ones whose margin numbers are actually trustworthy.
Why Automating This Calculation Without Manual Validation Fails
Automation is a false floor.
Brands run the TACoS contribution margin model through a connected dashboard, watch the numbers populate cleanly, and decide the math is sound. It isn't. The automation is only as accurate as the data sources it pulls from — and those sources carry the same gaps the manual pull does.
When FBA fee categories aren't manually mapped to the correct cost layer, the numbers drift. When return rates are averaged across a catalog instead of tracked at the ASIN level, the distortion compounds. When storage overhead is excluded because it doesn't appear in the default export, the contribution margin output looks reasonable.
The oil pressure gauge shows green. The engine is still running hot. what that looks like in practice
Manual validation isn't optional overhead. It's the quality control step that determines whether the calculation produces a real margin number or a convincing-looking fiction.
Brands that skip it aren't running a contribution margin model. They're running an ACoS model with extra steps — and getting the same blind spots they were trying to escape. Automation doesn't fix that. It just hides where the gaps are.
| Fee or Cost Category | Included in Native Amazon Reports | Impact on Contribution Margin if Omitted | Manual Integration Required |
|---|---|---|---|
| Referral Fees | Yes — appears in transaction-level reports, but often aggregated rather than isolated per ASIN | Overstated net revenue; Layer 1 calculation starts from an inflated baseline | Yes — must be mapped per ASIN and product category to reflect actual take-rate |
| FBA Fulfillment Fees | Partially — visible in some reports, but fee tiers shift with product size and weight changes | Variable cost layer understated when fee tier changes are not tracked in real time | Yes — fee tier classifications must be reconciled manually against current product dimensions |
| Monthly Storage Fees | No — omitted from standard campaign and sales dashboards; appears only in separate fee reports | Layer 1 net revenue overstated; seasonal storage spikes become invisible margin drains | Yes — must be pulled from inventory reports and allocated per ASIN by storage period |
| Aged-Inventory Surcharges | No — not surfaced in seller-facing summary views; buried in long-tail fee category exports | Contribution margin calculation misses a compounding cost that grows the longer slow-moving inventory sits | Yes — requires regular reconciliation against inventory age reports, not a one-time pull |
| Return Processing Costs | No — return fees and restocking charges are excluded from most default dashboard exports | True variable cost per unit is understated; high-return ASINs appear more profitable than they are | Yes — return rates must be tracked at the ASIN level and applied as a variable cost in Layer 2 |
| Real-Time Storage Overhead | No — storage overhead fluctuates with inventory levels and is rarely reflected in live reporting | Layer 1 and Layer 2 calculations lag actual costs; margin decisions are made on stale data | Yes — requires active monitoring and manual integration rather than reliance on periodic report exports |
What a Healthy Contribution Margin Looks Like on Amazon — and What It Signals

So you've run the numbers. Now what do they actually mean?
There's no magic number that applies across every category, every price point, every fulfillment model. But the test doesn't change. The margin left after COGS, Amazon fees, and advertising has to be enough to justify continued investment. Not just cover it. Justify it. If it can't clear that bar, scaling spend doesn't fix the model — it funds the problem faster.
TACoS falling while total revenue holds or climbs — that's advertising working as a growth lever. Organic velocity is building. Spend efficiency is compounding. But when TACoS is rising and contribution margin is compressing at the same time, that's not a growth story. That's a subsidy. You're paying to maintain a number that looks like performance while the actual channel economics get worse underneath it.
Reading the Margin Signal: When to Accelerate and When to Pull Back
The margin signal only has two readings. The channel supports more advertising investment — or it doesn't. Holding course without adjustment isn't a strategy. It's avoidance.
Healthy margin, stable or falling TACoS — accelerate. Put capital behind the campaigns driving organic rank. The oil pressure gauge is reading clean. The engine can handle the load. Thin margin, climbing TACoS — stop scaling and fix the inputs first. Every dollar you push into advertising against a broken margin model is a dollar confirming the model doesn't work. Funding unprofitable product lines at scale isn't aggressive growth. It's an expensive way to learn what the contribution margin was already telling you.
This is what Full Operational Responsibility looks like in practice. Not chasing a lower ACoS. Not calling a sales velocity spike a win. Reading the actual margin signal — and making the investment decision the number supports. Not the one that looks best on a dashboard slide.
Who This Calculation Is — and Is Not — Built For
This calculation is built for brands that have something real to protect. Established product lines. Real revenue. A channel generating enough volume that the difference between a healthy and an unhealthy contribution margin is a meaningful dollar figure — not a rounding problem.
It's not built for solo operators running a single ASIN with no advertising history and no baseline TACoS data. And it's not built for brands whose decision-makers override the methodology the moment the margin signal contradicts what they expected to see. If your team needs to approve every bid adjustment before the model can run, the friction degrades the output before the numbers even land. The operational handling of your ad programs requires a counterpart — not a committee.
Brands that get the most from this model don't file the margin output in a performance deck. They use it to govern advertising investment the same way an operator governs any other variable cost — with discipline, consistency, and direct accountability at the P&L level. That's the standard Marketplace Valet holds every engagement to. Not the dashboard number. The actual channel economics.
| Contribution Margin After Ad Spend | Channel Health Verdict | Advertising Scale Decision | Structural Issue to Investigate |
|---|---|---|---|
| Strong — margin after all three layers supports continued ad investment with room to reinvest | Healthy — organic velocity is building and advertising is functioning as a growth lever | Accelerate — increase budget behind campaigns driving organic rank and catalog depth | None requiring immediate action — maintain reconciliation cadence and monitor TACoS trend |
| Acceptable — margin covers advertising cost but leaves limited buffer for reinvestment | Stable — channel is producing but not compounding; growth is flatlined rather than building | Hold — maintain current spend levels while auditing Layer 1 and Layer 2 inputs for hidden cost leakage | Fee categorization accuracy — confirm all FBA fees, storage charges, and return costs are flowing into the model |
| Thin — advertising spend is consuming most or all of the margin available after platform fees and COGS | At Risk — the channel is covering itself but not generating meaningful profit contribution | Reduce — pull back spend until the underlying margin structure is corrected and revalidated | COGS accuracy — reassess variable fulfillment costs and verify referral fee rates are current for the ASIN's category |
| Negative — advertising spend exceeds the margin available after Layer 1 and Layer 2 | Unsustainable — the channel is consuming capital rather than generating it; advertising is accelerating the loss | Pause — stop scaling spend immediately; the model is funding unprofitable volume | TACoS misalignment — advertising spend is not catalyzing organic growth; review campaign structure and bid logic before any reinvestment decision |
| Rising margin with falling TACoS | Compounding — organic velocity is outpacing ad dependency; the channel is becoming more efficient over time | Scale strategically — organic momentum supports increased investment in new ASINs or catalog expansion | None critical — validate that TACoS decline reflects genuine organic growth rather than reduced ad coverage on key terms |
| Falling margin with rising TACoS | Degrading — advertising dependency is increasing while profitability shrinks; the channel is being subsidized, not grown | Stop and audit — increasing spend will compound the margin problem, not solve it | Input validation — reconcile all three layers manually before drawing any strategic conclusion from the current numbers |
Frequently Asked Questions
The model isn't the hard part. The hard part is what happens when the output contradicts what your dashboard has been telling you for two years.
Here are the questions that come up most. Answered straight, before you commit to running the numbers.
Why does optimizing for a low ACoS often mask severe erosion in a brand's actual contribution margin?
ACoS only measures one thing: how efficiently ad spend converts to ad-attributed revenue. That's it. It says nothing about organic sales, nothing about platform fees, and nothing about whether the channel is profitable after costs are paid.
A brand can drive ACoS down by cutting bids — and simultaneously watch total channel revenue plateau or decline. The organic velocity the advertising was building starts to decay. The check-engine light looks calm. The oil pressure is dropping.
Focusing purely on campaign-level ACoS fails to measure how paid media spend catalyzes organic customer acquisitions. That's the blind spot. A low ACoS on a shrinking channel isn't efficiency. It's the metric flattering itself while the underlying business erodes.
What is the primary point of failure when brands try to calculate contribution margin using automated dashboard tools?
Incomplete cost inputs. That's the failure. Every time.
Automated dashboards pull campaign data cleanly. They don't pull FBA fulfillment fees, monthly storage charges, aged-inventory surcharges, and return processing costs into a single unified cost layer. Those figures live in separate fee categories across Amazon's reporting environment — and most dashboard tools weren't built to reconcile them.
Calculating real margins requires manual integration of FBA fee structures, return rates, and real-time storage overhead. When a brand skips that reconciliation, the contribution margin output looks reasonable. It's just calculated on incomplete data. The automation isn't wrong — it's working with the inputs it has access to. Those aren't the inputs the model requires.
What integration challenges arise when merging Amazon FBA fee structures with offline COGS data?
Amazon's fee structure and your offline COGS data don't share a common taxonomy. Your COGS records are organized around SKUs or product lines. Amazon's fee exports are organized around transaction types, fulfillment categories, and storage billing periods.
Mapping them to the same cost layer requires a manual translation step. There's no native export that does it for you.
Return rates add another layer of complexity. Amazon tracks returns at the order level. Your COGS model needs returns expressed as a variable cost rate per unit sold. When those two data structures don't align, the Layer 2 figure is an estimate — not a real number. Every layer below it inherits that imprecision.
Can a brand scale Amazon advertising profitably if its current contribution margin is below thirty percent?
Below a certain margin threshold, more ad spend doesn't drive growth. It speeds up the loss.
If the contribution margin left after Layers 1 and 2 is already thin — before advertising costs hit Layer 3 — the advertising doesn't fix that. It just exposes it faster, at higher volume.
The question isn't whether you can scale. It's whether the unit economics support scaling before the cost structure is fixed. In most cases: work the margin problem first. Fix the cost inputs. Then accelerate advertising once the model confirms the channel can support it. Scaling into a broken margin isn't growth. It's a faster drain.
How long does it typically take to audit historical TACoS data to identify hidden margin leaks?
There's no fixed number. It depends on how cleanly historical data was maintained and how many ASINs are in scope.
But the shape of the work is consistent: pull the fee data, reconcile it against COGS records, then map TACoS trends across enough periods to separate seasonal noise from structural margin drift.
A single period's TACoS figure tells you where the channel is today. A trend line tells you where it's been going. You need both. The audit isn't done until you can read both — and the trend line requires enough historical depth to actually show a direction, not just a moment.
Stop Watching the Wrong Gauge
Brands that optimize ACoS alone don't lose the channel overnight.
They lose it the way an engine runs hot before it knocks. Slowly. Quietly. The number looks manageable every month. And every month that passes without reading the real gauge is another month the margin erodes beneath the dashboard — invisible, until it isn't.
The three-layer model — Gross Revenue Minus Platform Fees, Subtract COGS and Variable Fulfillment Costs, Apply Your TACoS Figure to Isolate Advertising's True Margin Impact — doesn't replace your advertising strategy.
It replaces the illusion that campaign metrics tell you whether the channel is profitable.
That's the only shift that matters. ACoS is the check-engine light. TACoS is the oil pressure gauge. The contribution margin model is what tells you whether the engine should be running at all.
The question isn't whether you need a better metric.
The question is whether you're running the channel with the discipline to act on what the real metric tells you.
Marketplace Valet holds every engagement to that standard — contribution margin calculated correctly, advertising governed as a variable cost, and investment decisions that follow from the number. Not from the slide. Not from what the dashboard was built to show.
Your Amazon channel is generating real revenue. It deserves a gauge that tells you the truth. The brands that act on that reading compound. The ones that keep watching the wrong gauge eventually hear the knock.
ACoS is the check-engine light. Most brands have been watching it for years while the oil pressure dropped. That gap shows up on the P&L — not the dashboard. A free Amazon account audit is a 15–20 page review of your specific channel, built by operators who've run the numbers from the operator's side — not analysts optimizing what the client can see.