ACoS vs. TACoS: The Metric That Determines Amazon Channel Profitability
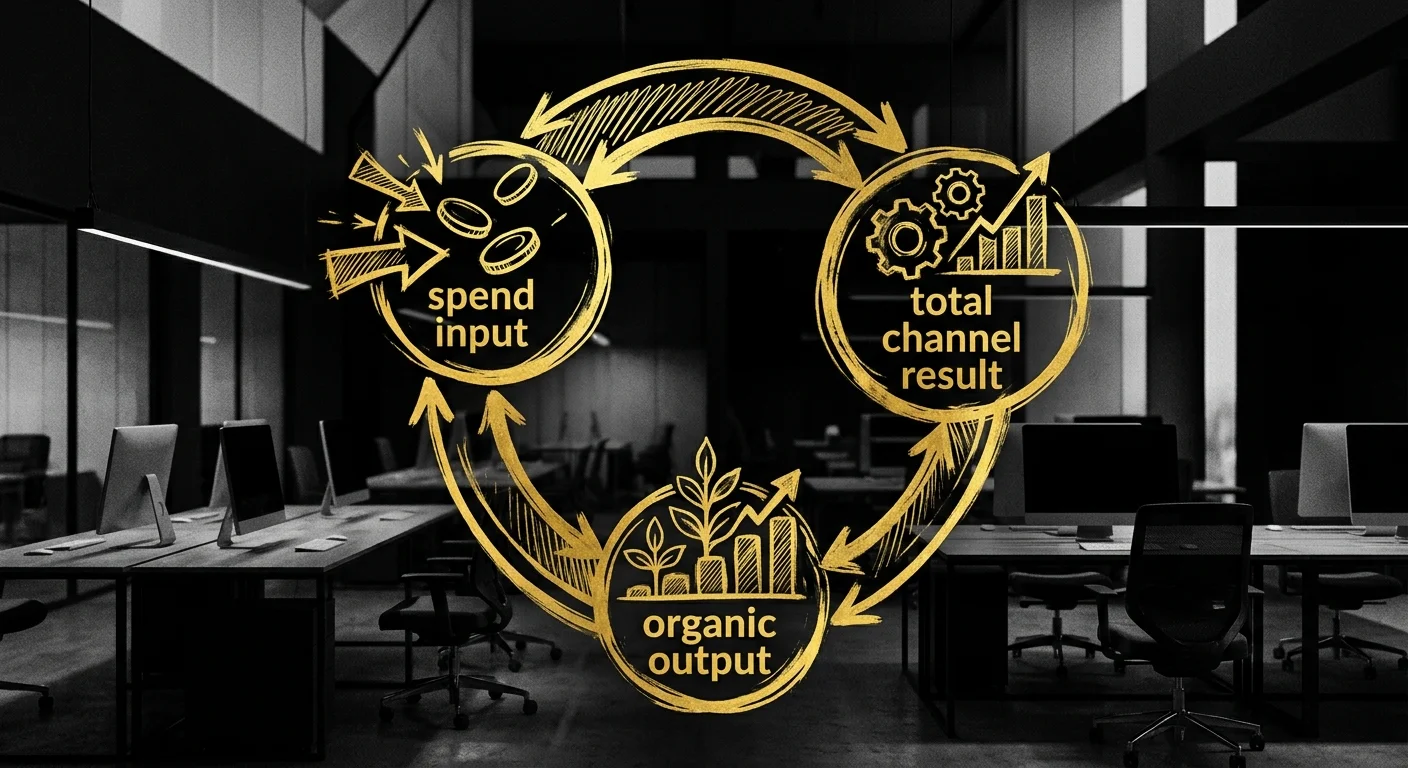
ACoS (Advertising Cost of Sale) measures ad spend against ad-attributed revenue only. TACoS (Total Advertising Cost of Sale) measures ad spend against total channel revenue — including organic sales. These are not two versions of the same metric. They answer different questions about channel health.
ACoS is calculated by dividing total ad spend by ad-attributed revenue. TACoS is calculated by dividing total ad spend by total channel revenue. A brand spending $50,000 in monthly ads against $200,000 in ad-attributed revenue has a 25% ACoS. If that same brand generates $500,000 in total channel revenue, its TACoS is 10%. The gap between those two numbers contains the information that determines whether the channel is actually profitable.
What ACoS cannot measure: organic sales velocity, contribution margin erosion, and whether advertising is building long-term brand authority or purchasing short-term attribution. A brand can maintain a stable, low ACoS while organic sales decline and margin compresses. ACoS produces no signal for this.
TACoS corrects for this by anchoring advertising performance to total channel revenue. When TACoS falls while total revenue grows, advertising is building organic velocity — the channel is becoming more efficient over time. When TACoS rises while revenue stagnates, advertising is sustaining a channel that is not growing on its own strength.
Amazon's advertising revenue reached over 46.9 billion U.S. dollars in 2023. The FTC has noted that Amazon's combined fees and advertising requirements can consume nearly half of a typical seller's total revenue. In that cost environment, managing advertising performance against a single campaign-level metric creates a measurement gap that compounds every reporting period.
TACoS is the channel-health metric. ACoS is a campaign diagnostic. They are not interchangeable, and treating them as equivalent is the primary source of misread Amazon P&L performance.
Last Updated: June 15, 2026
- • What ACoS Actually Measures — and What It Deliberately Ignores
- • Why Agencies and In-House Teams Default to ACoS
- • TACoS: The Metric That Sees the Whole Channel
- • TACoS Benchmarks and What the Numbers Mean for Your Brand
- • How to Shift from ACoS Optimization to TACoS Discipline
-
• Frequently Asked Questions
- • What is the primary difference between ACoS and TACoS on Amazon?
- • Why is a low ACoS sometimes misleading for total Amazon profitability?
- • What is a healthy TACoS benchmark for an established brand?
- • How does organic sales velocity affect my TACoS calculation?
- • How can a brand lower its TACoS without destroying its sales rank?
- • Can a brand have a rising ACoS and still be improving its Amazon channel health?
- • Stop Reading the Dashboard. Start Reading the Channel.
What ACoS Actually Measures — and What It Deliberately Ignores

ACoS isn't a broken metric. It's a precise metric aimed at the wrong question.
The formula is clean: divide ad spend by ad-attributed revenue. Campaign managers need that number. Bid optimizers run on it. It tells you which keywords are bleeding budget and which ad types are actually converting.
But the problem isn't what ACoS measures. It's what ACoS never counts — and how quietly that exclusion compounds.
That's the dashboard illusion.
A metric looks healthy on the screen while the underlying channel deteriorates. Think of it like a fuel gauge that reads full while the engine burns oil. ACoS is the fuel gauge. It tells you about one system. It says nothing about the engine.
The Definition ACoS Gives You
ACoS gives you a campaign-level efficiency ratio. Divide ad spend by ad-attributed revenue. What you get is a read on how tightly your advertising budget converts clicks into credited sales.
A lower number means more efficient ad spend per claimed revenue dollar. That's a legitimate read — at the campaign level.
So ACoS earns its place. It identifies keyword budget waste. It shows which ad types convert. It tells you where to reallocate inside a campaign structure. Sellers must balance advertising cost of sales with organic growth, tracking how ad spend drives overall catalog velocity.
ACoS captures only the first half of that equation.
The Blind Spot Built Into the Formula
The blind spot isn't an oversight. It's structural.
ACoS excludes organic revenue by design. Every sale driven by search rank, review volume, brand familiarity, or repeat purchase behavior — none of it appears in the ACoS denominator. Those sales exist. They drive channel profitability. ACoS simply doesn't count them.
Here's what that omission produces in practice. A brand aggressively cuts ad spend to improve ACoS. The efficiency ratio moves in the right direction. The dashboard confirms progress.
But the organic sales being primed by that advertising — the velocity feeding the algorithm, the rank positions being held — start to erode. ACoS looks better. The channel is weaker. what TACoS optimization actually corrects
Amazon's ad revenue crossed 46.9 billion U.S. dollars in 2023, per the company's own SEC filing. The FTC's complaint adds the other side of that equation: Amazon's fees and advertising requirements can eat up nearly half of a typical seller's total revenue. In that cost environment, a metric that ignores organic revenue isn't a conservative approach to measurement. It's a dangerous one. And incomplete measurements produce decisions that look right on a dashboard and wrong on a P&L.
Why ACoS Optimization Feels Right — Until the P&L Doesn't
ACoS optimization feels right because the number moves.
The dashboard confirms improvement. The agency presents a chart trending downward. That feedback loop is real — and it's exactly why the model survives in accounts where the P&L is quietly compressing. Visible progress and actual progress aren't the same thing.
The Amazon Account Management and Advertising Authority model starts from a different premise: the P&L is the report card, not the campaign dashboard.
When ad efficiency improves but contribution margin shrinks, the campaign won. The channel lost. Brands that optimize only for what ACoS can see will eventually find that the number on the screen and the number on the P&L have stopped telling the same story.
| Metric | What It Measures | What It Misses | P&L Visibility |
|---|---|---|---|
| ACoS | Ad spend divided by ad-attributed revenue — campaign-level efficiency ratio | Organic sales, repeat purchase behavior, brand search velocity, and contribution margin after Amazon fees | Partial — shows ad efficiency only; P&L requires organic revenue and total cost data |
| TACoS | Ad spend divided by total channel revenue — both ad-attributed and organic combined | Granular campaign-level bid performance and keyword-level efficiency within individual ad types | High — anchors advertising cost to the full revenue base the channel produces |
| Contribution Margin | Revenue remaining after Amazon fees, cost of goods, and advertising spend are deducted | Advertising efficiency ratios and campaign-level attribution breakdowns | Complete — the only metric that confirms whether the channel is profitable after all costs |
| Organic Sales Velocity | Rate at which a product generates sales without direct ad attribution — driven by rank, reviews, and brand familiarity | How much of that velocity is being sustained or primed by concurrent advertising investment | Indirect — reveals channel momentum but requires pairing with TACoS to interpret ad dependency |
| Campaign ROAS | Ad-attributed revenue generated per dollar of ad spend — mirrors ACoS as an efficiency signal | Total channel revenue, organic velocity, fee structure, and product-level margin contribution | None — a platform-reported efficiency ratio with no connection to channel P&L or profitability |
Why Agencies and In-House Teams Default to ACoS

ACoS stuck because it fits on a slide.
Every Amazon advertising console surfaces it by default. Agencies built decks around it. In-house teams set quarterly targets against it. The number is clean, directional, and easy to defend in a meeting — which is exactly why it became the industry standard. Not because it was the most useful metric. Because it was the most visible one.
That visibility creates its own gravity. When a number trends down and the dashboard turns green, no one asks what it isn't counting. Managing ad budgets in silos without aligning them with total retail sales channels leads to over-allocation on low-margin products. The dashboard never signals that problem. The silo is invisible from inside it.
This is not ignorance. It is optimization pressure pointed at the wrong target.
The ACoS-Only Optimization Model and Why It Fails
The ACoS-only model treats Amazon advertising as a standalone efficiency problem. Lower the ratio. Tighten the bids. Cut the underperforming keywords. Each of those moves is defensible at the campaign level. But campaign performance and channel performance are not the same question — and the model only answers one of them.
The FTC's complaint against Amazon noted that fees — advertising, fulfillment, and the rest — can eat up nearly half of a typical seller's total revenue. In that environment, optimizing only for campaign efficiency means solving a fraction of the margin equation while the rest of the P&L compounds unchecked. The ad reports look better. The channel quietly deteriorates behind them.
Here's the structural failure. ACoS optimization rewards cutting ad spend when efficiency drops. But that cut often kills the organic velocity the advertising was building. Rank erodes. Review velocity slows. Competitors absorb the share. The ACoS ratio improves. The channel weakens. What that compression does to contribution margin is where brands finally see the full cost of the wrong metric.
In-house media buyers inside this model aren't making bad decisions with good data. They're making reasonable decisions with incomplete data. The metric they were handed can't see the full channel. That's not a people problem. It's a structural one — and it won't fix itself by hiring someone smarter to watch the same dashboard.
Who This Approach Hurts — and Who It's Not For
This isn't for brands whose internal teams want to own advertising strategy and hand execution to an outside party. That structure — brand controls the metric, agency pulls the levers — is exactly the arrangement that produces well-reported campaigns on deteriorating channels. When strategy accountability and execution accountability live in different rooms, P&L accountability belongs to neither.
And it's not for brands that hand an agency an ACoS target and call that a reporting framework. If that's the scorecard, the agency will optimize for it. A well-reported channel isn't the same as a well-run one. Brands that measure success by campaign efficiency will always find an agency willing to win on that measure — regardless of what's happening to the underlying P&L.
Brands that need full channel accountability — advertising evaluated against total revenue, contribution margin, and organic velocity — need a partner accountable for all three. That's what Marketplace Valet is built for. Not for brands still measuring channel health by how clean the campaign dashboard looks.
| Agency or Team Behavior | The Metric Reported | The Channel Reality Hidden | Cost to the Brand |
|---|---|---|---|
| Reports ACoS as the primary campaign performance metric in client dashboards and quarterly reviews | ACoS (ad-attributed efficiency ratio) | Organic revenue erosion, rank position degradation, and contribution margin compression go unmeasured | Brand receives well-formatted reports on a channel that is quietly losing ground |
| Sets quarterly ACoS reduction targets without aligning those targets to total channel revenue or organic velocity | ACoS trending downward | Ad spend cuts that improve the ratio simultaneously starve the algorithm of the velocity signals that sustain organic rank | Lower ACoS score masks declining organic share and shrinking total channel revenue |
| Manages advertising campaigns in isolation from fulfillment costs, return rates, and category-level margin data | Campaign-level ROAS or ACoS by ad type | Over-allocation of ad budget to low-margin products that cannot sustain profitability after Amazon's combined fee structure | Ad spend optimized toward products that generate revenue but erode P&L contribution |
| Treats bid adjustments and keyword pruning as the primary levers of channel performance | Keyword-level efficiency and impression share | Brand authority signals — review velocity, listing quality, unauthorized seller activity — accumulate risk outside the campaign view | Channel defense gaps compound while the team focuses exclusively on campaign-level optimization |
| Presents declining ACoS as proof of strategic progress during agency performance reviews | Period-over-period ACoS improvement | TACoS trend and total channel P&L — the metrics that would reveal whether the channel is actually growing or contracting — are never surfaced | Brand leadership approves continued spend against a reporting framework that cannot detect channel deterioration |
TACoS: The Metric That Sees the Whole Channel

TACoS closes the gap ACoS leaves open.
It measures total ad spend against total channel revenue — ad-attributed and organic combined. That means it sees the whole business. Not just the campaign.
That distinction is not cosmetic. ACoS tells you how efficiently ads converted ad-driven clicks. TACoS tells you whether the channel is growing, holding, or quietly deteriorating underneath the ad activity.
Different questions. Different consequences.
Sellers must balance advertising cost of sales with organic growth, tracking how ad spend drives overall catalog velocity. TACoS is the metric built for exactly that obligation — it holds ad spend and organic performance in the same frame so the relationship between the two is actually visible.
How TACoS Is Calculated and What the Formula Reveals
The formula is simple: divide total ad spend by total revenue — ad-attributed plus organic — then multiply by 100. That percentage shows how much of your entire channel's revenue advertising is funding.
Not campaign revenue. Channel revenue. There's a difference.
What the formula reveals is the dependency ratio. A brand at 20% TACoS is funding one in five revenue dollars through paid placement. A brand at 8% TACoS on the same catalog is generating most of its revenue organically — with advertising acting as an accelerant, not a crutch. Understanding the margin implications of that ratio is where the P&L conversation starts.
ACoS lives inside that calculation. It is the campaign-level view of how the numerator is performing. TACoS holds the denominator accountable.
When the denominator grows while the numerator holds steady, the channel is building. When the denominator stalls while the numerator climbs, the channel is deteriorating — regardless of what the ACoS chart shows.
The Relationship Between Ad Spend and Organic Velocity
Amazon advertising does two things at once. It generates attributed revenue from clicks. And it feeds the algorithm — impressions, click-through signals, purchase velocity — that determines where a listing ranks organically.
ACoS-only reporting captures the first effect. It ignores the second entirely.
That second effect is organic velocity. As Amazon Advertising Management builds keyword relevance and sales history through paid placements, organic rank climbs. When advertising gets cut to chase a lower ACoS, the velocity feeding that rank starts to erode.
The organic sales don't disappear immediately. But the signal degrading them is already in motion.
TACoS captures that dynamic. As organic velocity builds, total revenue grows while ad spend holds steady or declines — TACoS falls. When advertising is the only thing holding revenue together, cutting spend reveals the dependency immediately.
TACoS tells you which scenario you are actually in. ACoS cannot.
Reading TACoS Movement Over Time
TACoS movement over time is the diagnostic signal campaign-level metrics cannot produce. Declining TACoS on a growing revenue base means one thing: organic traction is compounding, and advertising is becoming proportionally cheaper per dollar of total revenue.
Amazon's ad revenue reached over 46.9 billion U.S. dollars in 2023. The brands insulated from rising PPC costs are the ones with strong organic velocity. They're less dependent on paid placement to hold their numbers. That insulation never shows up in ACoS.
A rising TACoS on flat or declining revenue is the opposite signal — and the more dangerous one. It means advertising is working harder to produce the same or less total output. The channel is not building organic momentum.
The brand is paying more to stand still.
That is the engine burning oil while the fuel gauge reads full. TACoS is the oil pressure light. ACoS will never show it.
| TACoS Signal | What the Movement Means | Likely Cause | Recommended Action |
|---|---|---|---|
| TACoS falling, revenue growing | Organic velocity is compounding — advertising is becoming proportionally less expensive per dollar of total revenue | Paid placements have built keyword relevance and sales history strong enough to generate self-sustaining organic rank | Hold or modestly scale ad spend; protect organic rank by maintaining inventory health and listing integrity |
| TACoS falling, revenue flat | Ad spend is being cut — but organic velocity is not filling the gap; the channel is contracting quietly | Bid reductions or budget cuts made to chase a lower ACoS ratio without accounting for the organic signal those ads were feeding | Audit the relationship between recent spend reductions and organic rank movement before interpreting the TACoS drop as progress |
| TACoS stable, revenue growing | The channel is scaling efficiently — advertising spend is growing in proportion with total revenue | Coordinated investment across the catalog is generating both attributed and organic sales at a consistent rate | Maintain spend discipline and monitor for organic share gains that would allow a gradual TACoS reduction over time |
| TACoS rising, revenue flat | Advertising is working harder to produce the same output — the channel is not building organic momentum | Loss of organic rank, increased competition on key terms, or listing health issues driving up cost-per-conversion | Investigate root cause before increasing spend further; rising TACoS on flat revenue signals a channel dependency problem, not a budget problem |
| TACoS rising, revenue declining | The channel is in active deterioration — advertising is subsidizing a collapsing organic base | Sustained underinvestment in listing quality, brand protection, or catalog health has eroded the organic foundation the ad spend was supporting | Treat this as a channel-level crisis, not a campaign optimization problem; address listing integrity, unauthorized seller exposure, and content gaps before adjusting bids |
TACoS Benchmarks and What the Numbers Mean for Your Brand

Knowing your TACoS is 18% tells you almost nothing by itself.
But knowing brands in your category at your maturity stage run between 8% and 12%? That tells you everything. Your channel is running on paid dependency — not organic traction. That gap is the whole diagnosis.
Benchmarks exist because Amazon's advertising market is not a level field. Amazon's ad revenue reached over 46.9 billion U.S. dollars in 2023 — but that capital is not distributed evenly across categories.
Highly competitive verticals — supplements, electronics, personal care — carry structurally higher TACoS because paid placement is the only way to hold front-page visibility. Adjacent categories with lower PPC density reach profitability at much lower spend ratios.
The number that looks alarming in one category is standard operating procedure in another.
A 20% TACoS in a high-competition category is a fundamentally different signal than a 20% TACoS in a low-competition one. The number is the same. The meaning is not.
Context isn't optional — it's the whole interpretation. Strip it out and a TACoS reading is just a percentage floating in a vacuum. Benchmarks anchor it to something real. And that context only becomes actionable when you're reading your advertising reports through a profitability lens.
Category-Level TACoS Ranges and How to Use Them
Category-level TACoS ranges reflect the structural economics of each vertical. Not arbitrary targets someone decided to publish — the actual math of how the platform extracts value from sellers.
According to Harvard Business Review, retailers running ad platforms capture margins that dwarf what most sellers earn — a margin asymmetry that puts sellers in high-extraction categories in one specific position: organic velocity isn't optional. It's the mechanism that offsets what the platform takes.
Without it, the P&L never closes — regardless of how clean the ACoS looks.
Here's the directional framework. Established brands in lower-competition categories should target a TACoS below 10% — that's what healthy organic traction looks like when paid placement isn't structurally required to hold rank.
Mid-competition categories generally run between 10% and 15%. High-competition verticals can operate at 15% to 20% without signaling a problem — provided revenue is growing and organic velocity is trending upward.
Above 20% in any category demands scrutiny. The channel is either in a launch phase or it's running on dependency.
These ranges aren't a pass-or-fail score. They tell you whether your paid-to-organic ratio is consistent with brands running a healthy P&L in your competitive environment.
A TACoS inside the range on a growing revenue base means the strategy is working. Hold it.
A TACoS inside the range on flat revenue is a warning. Organic momentum is stalled — even if the number looks acceptable. The range doesn't catch that. Revenue trend does.
What Healthy TACoS Looks Like at Different Channel Maturity Stages
Channel maturity changes what a TACoS number means — completely.
A brand launching its first ASINs will run a high TACoS. It should. Advertising is doing all the heavy lifting: building purchase history, generating reviews, establishing keyword relevance where none existed before.
A TACoS of 25% or higher during a launch phase isn't a red flag. It's the cost of building signal on a blank channel. The benchmark ranges for established brands don't apply here.
A maturing channel looks different. As organic rank builds and repeat-purchase behavior develops, total revenue grows faster than ad spend. TACoS should compress over time — without any reduction in advertising investment.
If it doesn't compress, the channel isn't building organic traction. The advertising is generating revenue. But it's not compounding into anything the brand owns.
That's the distinction. Revenue with compounding organic velocity versus revenue that disappears the moment the ad budget drops.
An established brand at benchmark TACoS levels has confirmed something specific: advertising is acting as an accelerant on a channel that generates organic revenue independently.
That's the dashboard reading full while the engine is actually healthy. Not the illusion — the real thing.
The only way to tell the difference is to measure the right number.
| Channel Stage | Typical TACoS Range | ACoS Likely Looks Like | What It Signals |
|---|---|---|---|
| New Launch | High — above category norms | Likely appears healthy or low due to limited organic sales base | Advertising is building purchase history and keyword relevance from zero — elevated spend is expected and appropriate |
| Growth Phase | Moderating — declining from launch highs | May appear to fluctuate as organic velocity begins to emerge | Organic traction is building; ad spend is beginning to compound into owned rank rather than rented visibility |
| Maturing Channel | Compressing toward category benchmark | Stable or improving — but now reflects a smaller share of total revenue | Organic sales are growing faster than ad spend; advertising is acting as an accelerant, not the primary revenue driver |
| Established — Healthy | At or below category benchmark, stable | Efficient on its own terms but tells only part of the story | Channel is generating organic revenue independently; advertising reinforces rank rather than sustaining it — the P&L closes |
| Established — At Risk | Flat or rising despite mature catalog | Appears clean or even improving as organic sales erode | Paid dependency has replaced organic traction; the dashboard looks acceptable while the underlying channel deteriorates — the dashboard illusion in its most dangerous form |
How to Shift from ACoS Optimization to TACoS Discipline
Knowing the benchmark is not the same as managing to it.
The real shift is structural. What gets measured changes. What gets reported changes. What triggers a decision changes. That is a different operating model than a campaign dashboard — and most brands never make the switch.
The ACoS-optimization review cycle asks three questions: Did the campaign spend efficiently? Did it hit the ACoS target? Do we scale or cut?
That loop never asks what the advertising is doing to organic revenue. It never asks whether the channel is compounding or eroding underneath the paid layer. Managing ad budgets in silos without aligning them with total retail sales channels leads to over-allocation on low-margin products. The questions are simply not on the form.
TACoS discipline asks a different question at every decision point: what is the ratio of total ad spend to total channel revenue, and is that ratio moving in the right direction? That question cannot be answered from a campaign dashboard. It requires a different data pull entirely.
Amazon's fees and advertising requirements eat up nearly half of a typical seller's total revenue. A brand not tracking the full revenue picture — organic included — has no real line of sight to what the channel costs to run.
TACoS discipline is not a reporting preference. It is the floor for channel P&L accountability. And understanding how that ratio connects to contribution margin is where the numbers stop being abstract and start driving actual decisions.
Rebuilding the Reporting Stack Around TACoS
Most Amazon reporting stacks are built to answer campaign questions. Impression share, click-through rate, ACoS by ad group — those are the default exports of every advertising console. None of them produce TACoS.
Getting to TACoS requires pulling two data sets: total ad spend from the advertising console, and total channel revenue — attributed and organic — from the business report. Those two numbers do not live in the same place. You have to go get both of them.
That gap is not an accident. It reflects what the platform surfaces and what it buries. Brands that accept the default report are accepting the dashboard illusion — by design.
The operational shift starts with one weekly number: total ad spend divided by total channel revenue, expressed as a percentage.
That number belongs on the same report as organic units sold, total revenue, and ad-attributed revenue. The relationship between those figures — how they move together or against each other — is the actual signal. ACoS stays on the report for bid management. But it no longer drives the channel decision.
Those are two different conversations. They need to stay that way or the campaign dashboard absorbs the channel review and you are back where you started.
A single week's TACoS reading is directionally useful. It is not conclusive.
Four to six weeks of TACoS data, plotted against total revenue, reveals whether the channel is building organic traction or riding paid spend. That trend is the dashboard reading that actually tells you what is happening underneath the ad activity. One data point is a reading. Six is a story.
Connecting Ad Spend Decisions to Organic Sales Data
When a campaign scales up, the question is not just whether attributed revenue increases. The question is whether total channel revenue increases at a faster rate — meaning the advertising is feeding organic rank, not just capturing paid clicks.
Sellers must balance advertising cost of sales with organic growth, tracking how ad spend drives overall catalog velocity. That means the advertising decision cannot be made without the organic data in the room. Period.
Those are different outcomes. Only one of them builds a channel that compounds. The other one rents revenue — and stops the moment the spend stops.
When advertising is cut to chase a lower ACoS, the organic sales report tells you immediately whether the cut was safe or destructive.
If organic revenue holds after a spend reduction, TACoS compresses cleanly. That is a healthy signal — the channel has traction it does not need the ads to sustain. But if organic revenue drops alongside the spend cut, the advertising was load-bearing. It was not just capturing clicks. It was holding rank.
ACoS never shows that distinction. It cannot. It only sees paid attribution. Organic sales data shows the full picture — every time.
The Operational Checkpoints That Prevent TACoS Drift
TACoS drift happens when no one is watching the ratio between reviews.
The campaign dashboard updates daily. TACoS moves slowly — often over weeks. Brands that review advertising performance weekly but review total channel economics monthly are operating with a built-in lag. Drift accumulates before anyone sees it. By the time the channel numbers surface in a monthly report, the compression has been running for a month already. You are not catching a problem. You are documenting one.
The fix is a weekly TACoS review running alongside the advertising review — not replacing it.
The advertising team reviews ACoS for bid management. That conversation stays. But the channel review asks a different set of questions: Did TACoS move this week? Did organic revenue move with it or against it? Does the current spend ratio match where we expect to be at this stage of catalog maturity?
Two separate conversations. Same cadence. That is the operational model — and without it, the campaign review absorbs everything and the channel question never gets asked.
The brands that maintain TACoS discipline over time are not the ones with the most sophisticated ad technology. They are the ones that treat channel P&L as a standing agenda item — not a quarterly report.
The dashboard illusion breaks when you build a review process that requires looking at organic data, not just campaign performance. That is the engine check, not the fuel gauge.
And it has to run on a schedule — not just when something looks wrong. By the time something looks wrong on a campaign dashboard, the channel has already told the story. You just were not reading it.
| Reporting Shift | Old ACoS-First Approach | TACoS Discipline Approach | Channel Impact |
|---|---|---|---|
| Primary performance metric | ACoS by campaign and ad group | TACoS across total channel revenue | Shifts the decision lens from campaign efficiency to channel health |
| Data sources reviewed | Advertising console exports only | Advertising console spend plus business report organic revenue | Eliminates the blind spot between paid performance and organic traction |
| Review cadence | Weekly campaign performance check | Weekly TACoS trend alongside weekly advertising review | Prevents drift from accumulating undetected between reporting cycles |
| Scaling trigger | Campaign ACoS hits target — scale spend | Total channel revenue grows faster than ad spend — scale spend | Ensures advertising is building organic rank, not just capturing paid clicks |
| Cut trigger | ACoS exceeds target — reduce spend | TACoS compresses while organic revenue holds — reduce spend safely | Distinguishes load-bearing spend from inefficient spend before making cuts |
| Channel accountability frame | Campaign-level deliverables reported to marketing team | Channel P&L reviewed as a standing agenda item | Treats Amazon as a business with its own economics, not a campaign to optimize |
Frequently Asked Questions
These are the questions brands ask when they stop trusting the dashboard. Some are clarifying. Most are objections looking for a reason to stay comfortable.
None of these answers hedge. If the framework you have been working with cannot survive a full channel P&L, this section will say so.
What is the primary difference between ACoS and TACoS on Amazon?
ACoS measures ad spend as a percentage of ad-attributed revenue only. Spend $1,000, generate $5,000 in attributed sales — your ACoS is 20%. That number tells you nothing about organic revenue.
TACoS measures total ad spend as a percentage of total channel revenue — attributed and organic combined. That same $1,000 in spend against $10,000 in total channel revenue gives you a 10% TACoS. That number tells you what advertising actually costs relative to the full business.
The distinction is not cosmetic. Organic revenue is the part of the channel that compounds. ACoS cannot see it. TACoS cannot ignore it.
Why is a low ACoS sometimes misleading for total Amazon profitability?
A low ACoS means campaigns are converting efficiently on ad-attributed clicks. It does not mean the channel is healthy.
A brand running 12% ACoS with declining organic sales is running efficient ads on a deteriorating channel. Those are two different problems that look like one clean number on a dashboard.
With Amazon's ad revenue reaching over 46.9 billion U.S. dollars in 2023, PPC competition has intensified to the point where advertising is doing structural work — holding rank, not just capturing intent. Cut spend to chase a lower ACoS and you do not just reduce costs. You pull the support structure out from under the organic position.
The dashboard reads clean. The channel quietly loses ground. That is the dashboard illusion — and a low ACoS is exactly where it hides.
What is a healthy TACoS benchmark for an established brand?
There is no single number that works across every category and every catalog stage. But there is a directional framework worth knowing.
An established brand with strong organic velocity — dominant keyword positions, high review counts, consistent repeat-purchase behavior — should see TACoS in the single digits to low teens. A brand seeding new ASINs or entering a competitive category will run higher intentionally. That is not a warning sign. That is the cost of building a position.
The benchmark that matters most is your own trend line. TACoS compressing over time — without cutting spend — confirms that advertising is building organic authority, not just buying revenue. TACoS holding flat or rising while spend stays constant signals a channel that is not compounding. It is going nowhere expensive.
Your category matters. Your trajectory matters more.
How does organic sales velocity affect my TACoS calculation?
Organic velocity is what moves TACoS. Not bids. Not budgets. Organic velocity.
TACoS is total ad spend divided by total channel revenue. When organic sales grow — stronger rank, better reviews, compounding repeat purchases — the denominator gets bigger without touching the ad spend line. TACoS drops. That is a healthy channel building equity.
The reverse is uglier and harder to catch. When organic velocity declines — suppressed listings, unauthorized sellers eroding your pricing, review velocity stagnating — total revenue contracts while ad spend holds. TACoS rises even when ACoS stays flat. The campaign dashboard shows no problem. The channel is losing ground, and the metric you are watching cannot see it.
Organic sales velocity is not a supporting metric. It is the variable that determines whether your advertising investment is building something permanent — or just renting a position that collapses the moment the spend stops.
How can a brand lower its TACoS without destroying its sales rank?
The lever is organic velocity. Not spend reduction.
Cutting ad spend to lower TACoS is the most common mistake brands make with this metric. It frequently destroys the organic rank the advertising was holding up. You do not cut a load-bearing wall to lower the renovation budget.
The correct move is to grow total revenue faster than ad spend grows. That means investing in the inputs that drive organic performance: listing quality, review velocity, inventory health, pricing integrity. As organic sales increase, TACoS compresses naturally — because the denominator grows, not because the numerator shrank.
As the Forbes Agency Council notes, sellers must balance advertising cost of sales with organic growth, tracking how ad spend drives overall catalog velocity. That means every spend adjustment gets tested against the organic sales data — not just the campaign efficiency report. If organic revenue holds after a cut, the cut was safe. If it drops with it, the advertising was structural. The organic data tells you which scenario you are in. ACoS never will.
Can a brand have a rising ACoS and still be improving its Amazon channel health?
Yes. And this is the pattern most Amazon reporting trains brands to misread.
Rising ACoS alongside falling TACoS means advertising is working harder on attributed revenue while organic revenue is growing faster than total spend. The channel is building traction. The campaigns are doing their structural job — holding rank, seeding organic velocity — even if the ad-attributed efficiency ratio has loosened.
This happens during aggressive catalog expansion, new keyword seeding, or when a brand is deliberately investing in category position. With Amazon's ad revenue exceeding 46.9 billion U.S. dollars in 2023, the platform's own economics have shifted — retail media networks can yield margins of 50% to 70% for retailers, which means Amazon rewards brands that build organic share, not just ad efficiency.
A brand that reacts to rising ACoS by cutting spend — without checking what TACoS is doing — will often kill a compounding cycle at its most productive point. The ACoS number looked wrong. The channel was actually winning.
That distinction only exists if you're watching both numbers. Most brands are only watching one.
Stop Reading the Dashboard. Start Reading the Channel.
The dashboard isn't lying to you. That's exactly the problem.
A low ACoS is a real number. It reflects real efficiency on real ad-attributed revenue. But the channel is larger than what any campaign report can show. And what it cannot show you is whether the organic half of that channel is healthy, eroding, or already gone.
TACoS doesn't replace advertising discipline. It completes it.
ACoS tells you whether your campaigns are running efficiently. TACoS tells you whether the channel is building something that compounds — organic rank, repeat purchases, keyword authority — or simply converting paid clicks into revenue that disappears the moment the spend stops.
Those are not the same question. Most brands are only asking the first one.
Marketplace Valet measures both — because the brands we work with are accountable to a P&L, not a campaign report. Justin Boggs has tracked this pattern across hundreds of accounts: the ACoS looks clean, the campaigns look optimized, and organic velocity has been quietly declining for months. The metric you lead with determines which version of the channel you can actually see.
Stop reading the dashboard as if it represents the channel. It represents the ads.
The channel is the ads plus organic rank, plus review velocity, plus listing health, plus unauthorized seller exposure — the full picture a single campaign metric was never designed to show.
If your Amazon reporting is built around ACoS, you're managing a fraction of the channel and calling it the whole thing.
Shift the primary metric to TACoS. Build a weekly review that puts organic data in the same room as campaign data. Treat the ratio between your ad spend and your total revenue as the number that tells you whether the channel is actually healthy — not just whether the campaigns are running clean.
The fuel gauge can read full while the engine burns oil. TACoS is the engine check. The only question left is whether you're running it — or still watching the fuel gauge and calling it a strategy.
That's the dashboard illusion in its simplest form: the ads look clean, the campaigns look optimized, and the channel is eroding in the background where ACoS can't see it. If your reporting stops at ACoS, you don't have a picture of your channel — you have a picture of your campaigns. A free Amazon account audit puts the full picture on the table — organic velocity, listing health, pricing integrity, and the TACoS trend that tells you whether your channel is building real equity or quietly burning margin.